Signals of Distress: High Utilization of Criminal Legal and Urgent and Emergent Health Services in San Francisco

PRESS RELEASE: New Report Shows Patterns of Health and Legal System Utilization for Small Number of Extremely Vulnerable San Francisco Residents
People with multiple, complex health and housing needs frequently receive fragmented care because the providing systems operate independently. Typically, individuals who come into frequent contact with the emergency medical system (e.g., emergency departments; emergency medical services) also interact with other health services and public systems such as psychiatric facilities, substance use treatment centers, shelters, and jails. Cross-sector care coordination is limited, in part, because data systems are not linked across physical health, behavioral health (mental health and substance use), housing, and criminal legal systems.
To help San Francisco better serve this high need population, the California Policy Lab at UC Berkeley and the UCSF Benioff Homelessness and Housing Initiative worked with our partners in San Francisco’s public health and criminal legal systems to link together ten years of data from the physical health, behavioral health, housing, and criminal legal sectors. Using these linked data, we identify individuals with high utilization of the criminal legal system and the medical and behavioral health systems in a single year. High criminal legal utilization is defined as at least three jail bookings in a year, while high healthcare utilization is seven or more urgent/emergent healthcare contacts in a year.
To understand trends before and after a year of high utilization, we analyze two cohorts. The 2011 cohort includes 211 people with high utilization of both systems in fiscal year 2011, while the 2020 cohort includes 161 individuals with high utilization of both systems in fiscal year 2020.
Key Findings
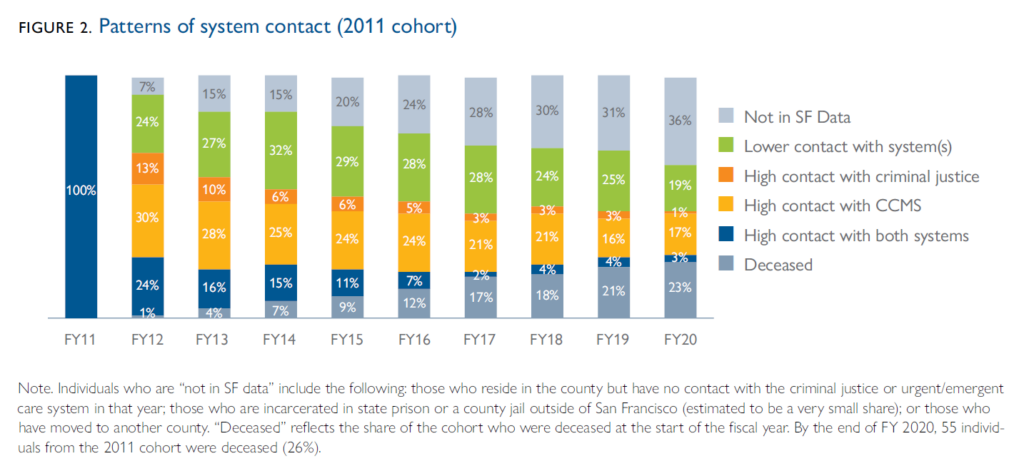
1. Twenty-five percent of the individuals in the 2011 cohort of high, dual-system utilization continued their dual-system high frequency contact the following year. Overall, the 2011 cohort had a startling death rate: by the end of the ten-year period, at least one quarter of the cohort was deceased (26%).

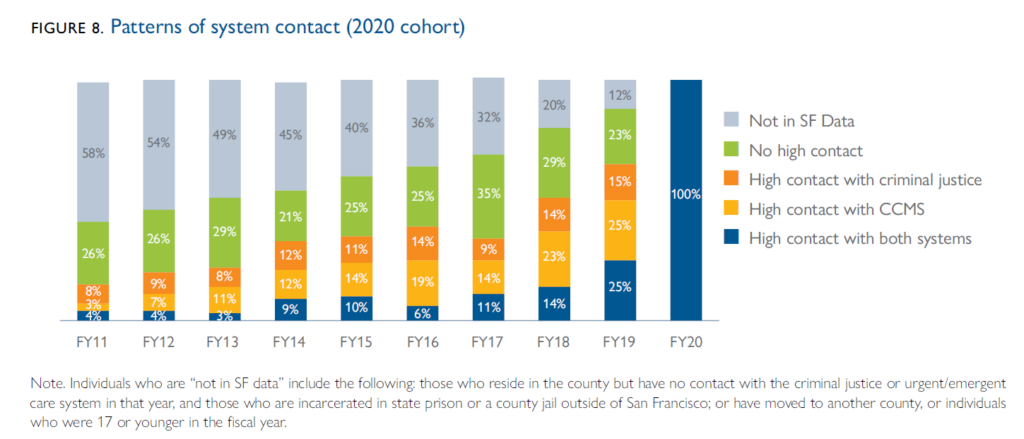
2. Forty-two percent of individuals in the 2020 cohort of high, dual-system utilization were in San Francisco and received urgent/emergent healthcare services or were booked into jail 10 years prior to their year of high utilization.
3. The share of individuals in the 2011 cohort who had frequent criminal justice system contact declined over time, however many continued to be arrested and booked into jail after FY 2011.

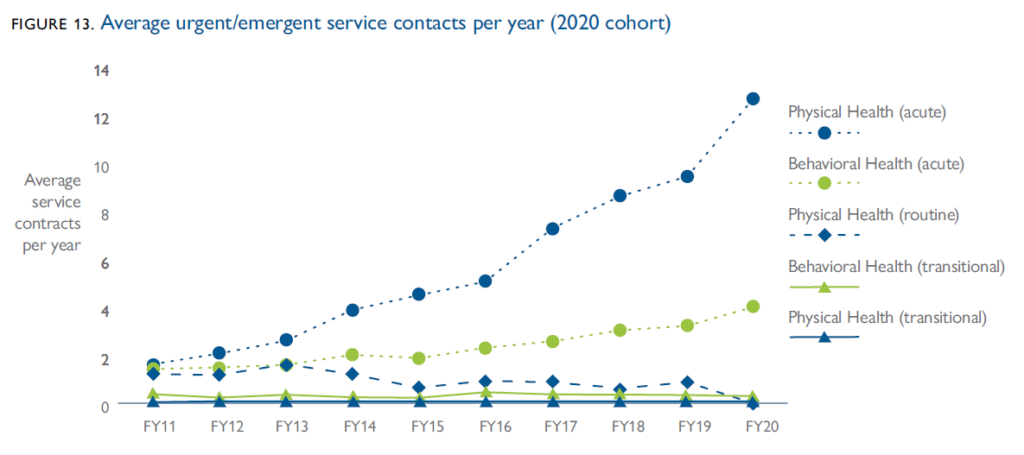
4. The most frequent services accessed by the 2020 cohort in the decade before their high utilization were acute services for physical health and behavioral health needs. Over time, the frequency of contact of routine medical visits and transitional health and behavioral health services remained steady, while contacts with acute services increased. Acute physical health contacts include emergency department visits and medical hospital stays, and acute behavioral health services include psychiatric emergency services visits, detoxification stays, and mental health hospitalizations. In particular, acute medical service contacts grew from fewer than 2 per year on average in FY 2011, to more than 12 per year in FY 2020. The growth in acute behavioral health contacts was driven by an increase in acute services for mental health needs leading up to FY 2020, while the average contacts for acute substance use services remained stable over time.

Select Media Coverage
SF Examiner: Three ways to improve San Francisco’s fragmented homelessness system (10-18-22)
SF Chronicle: Will a new lawsuit finally convince San Francisco its homeless sweeps are futile? (10-1-22)
SF Chronicle: Study: San Francisco’s fragmented city services are harming—and killing—the most vulnerable (9-27-22)